
Introduction to Data Analytics
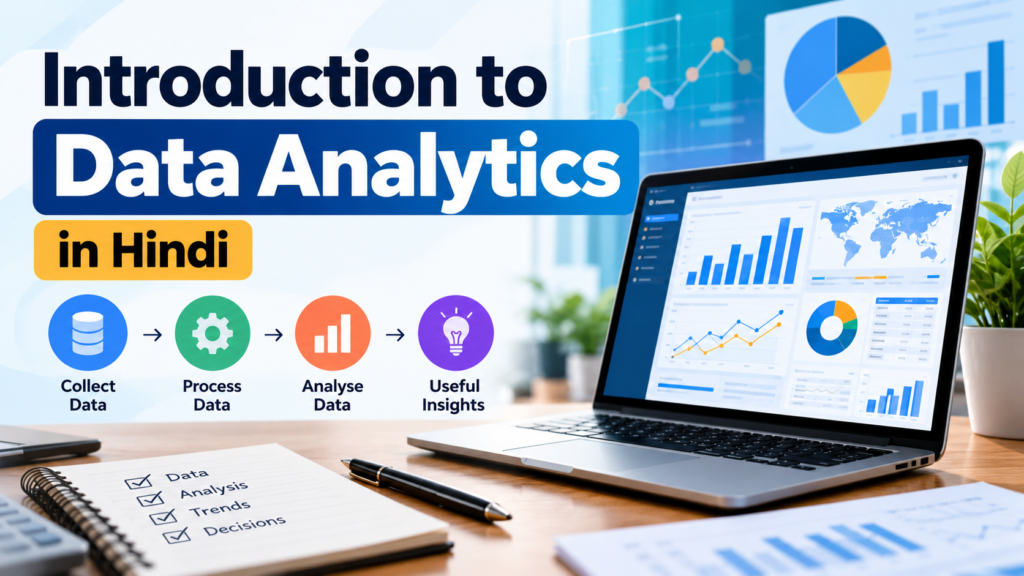
Introduction to Data Analytics is the process of collecting, organizing, and analyzing data to find useful information. In this beginner-friendly guide, you will learn the basics of data analytics, its real-life applications, career opportunities, types of data, and the four types of data analytics.
Today, data analytics is used in many industries, including e-commerce, healthcare, banking, transportation, and manufacturing. In this guide, you will learn the basics of data analytics, its real-life applications, career opportunities, types of data, and the four major types of data analytics.
What Is Data Analytics?
Data analytics means examining raw data to discover useful insights. These insights help businesses understand their performance, identify problems, and make informed decisions.
For example, a computer institute can analyse its admission records to identify which courses are popular, how many students enrol each month, and which marketing activities generate more enquiries.
In simple words, data analytics converts raw data into meaningful insights that help us make better decisions.
Real-Life Examples of Data Analytics
1. E-commerce Product Recommendations
Online shopping platforms analyse customers’ browsing history, previous purchases, and product preferences to recommend relevant products.
For example, if you search for a laptop, a shopping website may suggest similar laptops based on your budget and preferred specifications.
2. Uber and Driver Allocation
Ride-booking platforms use location data and driver availability to help connect passengers with nearby drivers. This helps improve the booking process and manage waiting times.
3. Google Maps and Route Selection
Google Maps uses location and traffic information to estimate travel time and suggest suitable routes. Users can compare routes and choose one according to current traffic conditions.
4. Risk and Fraud Detection
Banks analyse transaction records and spending patterns to identify unusual activities. These findings can help flag potentially fraudulent transactions for further investigation.
5. Healthcare and Contact Tracing
Data analytics helps healthcare organizations study health trends and patterns. During the COVID-19 pandemic, India’s Aarogya Setu app used Bluetooth-based proximity information to support contact-tracing efforts.
Career Scope in Data Analytics
Data analytics offers different career paths for people interested in working with data. The responsibilities and required skills depend on the role and organization.
1. Data Analyst
A Data Analyst collects, cleans, and analyses data to identify trends and answer business questions. Excel, SQL, data visualization, and analytical thinking are useful skills for this role.
2. Data Scientist
A Data Scientist works with data to solve complex problems using statistical methods and, in many roles, machine learning. Python, statistics, and mathematics are commonly useful skills.
3. Business Intelligence Developer
A Business Intelligence Developer creates reports and dashboards to help businesses monitor performance. Power BI, Tableau, SQL, and data modelling are relevant skills.
Skills Required for Data Analytics
Excel for organizing and analysing data.
SQL for retrieving data from databases.
Power BI for creating dashboards and reports.
Python for data analysis and automation.
Problem-solving and analytical thinking.
Communication skills for explaining insights.
Practical projects and case studies help learners apply these skills to real-world situations.
What Is Data?
Data is a collection of facts, observations, or records. It can include numbers, text, dates, images, audio, and videos.
For example, student names, course details, admission dates, and fee records are all forms of data.
Based on its organization, data is commonly divided into three types.
1. Structured Data
Structured data follows a predefined format, usually arranged in rows and columns. It is generally easy to search, filter, and analyse.
Examples: Excel spreadsheets, student records, sales tables, and relational databases.
2. Semi-Structured Data
Semi-structured data does not follow a rigid table format but contains elements that help organize the information, such as tags, keys, or metadata.
Examples: JSON files, XML files, and emails containing structured headers and message content.
3. Unstructured Data
Unstructured data does not follow a predefined tabular format. It may require specialized methods to organize and analyse.
Examples: Images, audio recordings, videos, social media posts, and customer reviews.
Businesses can analyse customer reviews to identify common complaints, understand customer opinions, and improve their products or services.
How Does Data Become Information?
Raw data may not be useful until it is organized and analysed. Processing data helps us identify patterns and understand what the data represents.
For example, a business may have thousands of sales records. After organizing the records and analysing monthly sales, it may discover which products sell the most and during which months sales increase.
Raw Data → Data Processing → Analysis → Useful Information
This process helps people understand data and use the findings to make decisions.
Four Types of Data Analytics
There are four commonly discussed types of data analytics: descriptive, diagnostic, predictive, and prescriptive analytics. Each answers a different business question.
1. Descriptive Analytics — What Happened?
Descriptive analytics examines historical data to summarize past performance and identify trends.
Example: A company reviews its sales reports and discovers that revenue has decreased over the last six years.
Reports, charts, and dashboards are often used to present these findings.
2. Diagnostic Analytics — Why Did It Happen?
Diagnostic analytics investigates possible reasons behind a trend or result.
Example: After identifying falling sales, a company studies customer feedback, competitor activity, and pricing to understand possible causes.
This analysis helps the company investigate what may be affecting its performance.
3. Predictive Analytics — What Is Likely to Happen?
Predictive analytics uses historical data and analytical methods to estimate possible future outcomes.
Example: A company analyses previous sales trends to forecast future revenue. Online shopping platforms may also use customer activity to predict which products customers might prefer.
Predictions are estimates and are not guaranteed to be correct.
4. Prescriptive Analytics — What Should We Do?
Prescriptive analytics helps evaluate possible actions using data and analytical results.
Example: If sales are declining, a company may compare options such as improving its product, changing its marketing strategy, or adjusting its pricing.
The goal is to identify suitable actions based on the available evidence.
Difference Between the Four Types of Analytics
Descriptive: What happened?
Diagnostic: Why did it happen?
Predictive: What is likely to happen?
Prescriptive: What should we do?
These types can work together. A business may first understand its past performance, investigate the reasons behind it, estimate future results, and then evaluate possible actions.
Conclusion
Data analytics helps convert raw data into meaningful information for better decision-making. It is widely used in business, healthcare, banking, e-commerce, transportation, and many other industries.
Understanding data types and the four types of analytics builds a strong foundation for beginners. As you progress, learning Excel, SQL, Power BI, and Python will help you apply these concepts to practical datasets and projects.
Next Step: Practise identifying different types of data and classifying business questions into descriptive, diagnostic, predictive, and prescriptive analytics.
Data Analytics MCQ Practice Questions with Answers
Test your knowledge of data analytics with 11 multiple-choice questions covering data types, career roles, and the four types of data analytics. Check the answer key and explanations at the end to evaluate your understanding.
Quick Answers to Your Top Questions
| The Question | The Simple Answer |
1. What is data analytics in simple words? | Data analytics is the process of collecting, cleaning, and analysing data to find useful information. It helps people identify patterns, solve problems, and make better decisions. |
2. What are the four types of data analytics? | The four types of data analytics are descriptive, diagnostic, predictive, and prescriptive analytics. They help explain what happened, why it happened, what may happen next, and what action should be taken. |
3. What are the three types of data? | The three common types of data based on their organization are structured, semi-structured, and unstructured data. Examples include spreadsheets, JSON files, emails, images, audio, and videos. |
4. What is the difference between data and information? | Data consists of raw facts, observations, or records. Information is data that has been processed and interpreted to provide meaning and support decision-making. |
5. Where is data analytics used in real life? | Data analytics is used in online shopping, banking, healthcare, transportation, manufacturing, and marketing. It helps businesses understand customer behaviour, identify trends, detect suspicious transactions, and improve operations. |